

Traffic Heatmaps: Understanding User Behavior for Better Promotion 🔥
Table of Contents
1. Introduction to Traffic Heatmaps
2. What Are Traffic Heatmaps and How Do They Work?
3. Types of Heatmaps Every Marketer Should Know
4. Why Traffic Heatmaps Are Game-Changers for Digital Marketing
5. How to Read and Interpret Heatmap Data Like a Pro
6. Implementing Heatmap Insights for Better Promotional Strategies
7. Best Tools for Creating Effective Traffic Heatmaps
8. Common Mistakes to Avoid When Using Heatmaps
9. Real-World Success Stories
10. Conclusion
11. Frequently Asked Questions
Introduction to Traffic Heatmaps 📊
Picture this: you’ve just launched what you believe is the perfect website or landing page. The design looks stunning, the content is compelling, and you’re confident users will convert like crazy. But weeks pass, and your conversion rates are disappointingly low. Sound familiar? 😔
Here’s the thing – what looks good to us as creators doesn’t always translate to effective user experiences. That’s where traffic heatmaps come to the rescue! These powerful visualization tools act like X-ray vision for your website, revealing exactly how users interact with your content, where they click, how far they scroll, and what captures their attention.
In today’s competitive digital landscape, understanding user behavior isn’t just helpful – it’s absolutely essential for creating promotional strategies that actually work. Traffic heatmaps provide the missing piece of the puzzle, transforming guesswork into data-driven decisions that can dramatically improve your marketing ROI.
What Are Traffic Heatmaps and How Do They Work? 🎯
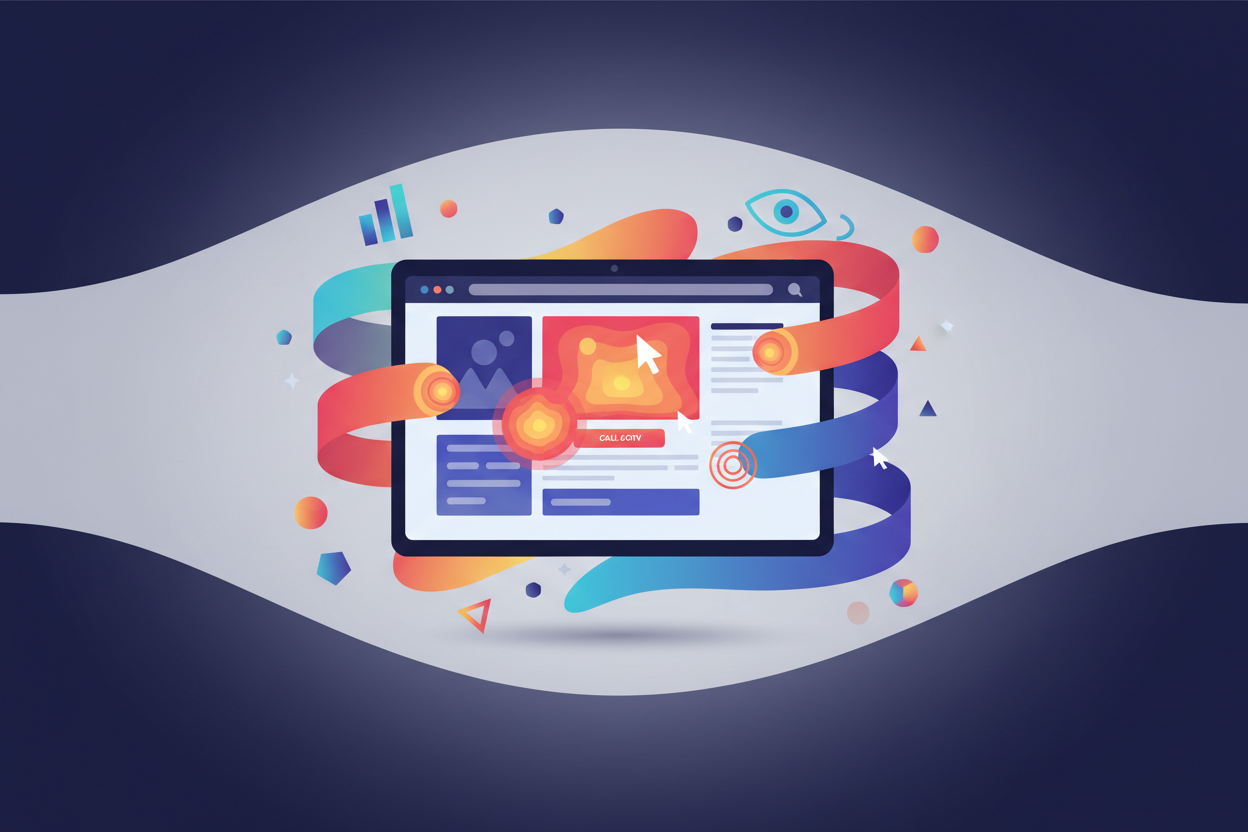
Traffic heatmaps are visual representations of user behavior on your website, displayed through color-coded overlays that show activity intensity. Think of them as thermal imaging for web pages – areas with high user engagement appear in “hot” colors like red and orange, while less engaging sections show up in “cool” colors like blue and green.
The technology behind heatmaps is surprisingly sophisticated yet elegantly simple. When you install heatmap tracking code on your website, it begins collecting anonymous user interaction data in real-time. This includes mouse movements, clicks, taps (on mobile devices), and scroll behavior. The software then aggregates this data and creates intuitive visual reports that anyone can understand at a glance.
What makes heatmaps particularly valuable is their ability to reveal the gap between what we think users do and what they actually do. You might assume users read every word of your carefully crafted headline, but heatmaps might show they’re actually focusing on a small image in the corner instead!
Types of Heatmaps Every Marketer Should Know 🔍
Click Heatmaps are probably the most straightforward type to understand. They show exactly where users click on your page, revealing which buttons, links, and elements are getting the most attention. I’ve seen cases where businesses discovered users were trying to click on non-clickable elements, missing important conversion opportunities!
Scroll Heatmaps demonstrate how far down the page users typically scroll before leaving. This data is pure gold for content creators and marketers because it shows the exact point where you’re losing your audience’s attention. If 80% of users never make it past the first screen, you know exactly where to place your most important promotional content.
Move Heatmaps track mouse cursor movements, which often correlate with eye movement patterns. While not 100% accurate for predicting where users look, these heatmaps provide valuable insights into user attention patterns and can help identify areas of interest or confusion.
Attention Heatmaps combine multiple data points to show which areas of your page receive the most overall user attention. These comprehensive views are particularly useful for optimizing promotional banners, call-to-action buttons, and key messaging placement.
Why Traffic Heatmaps Are Game-Changers for Digital Marketing 🚀
Traditional analytics tell you what happened, but heatmaps show you why it happened. This distinction is crucial for creating effective promotional strategies. When Google Analytics shows you have a high bounce rate, that’s concerning but not actionable. When heatmaps reveal that users are leaving because they can’t find your main call-to-action button, now you have something concrete to fix!
The beauty of heatmap data lies in its immediate actionability. Unlike complex statistical reports that require deep analysis, heatmaps provide instant visual feedback that even non-technical team members can understand and act upon. This democratization of user behavior data has revolutionized how marketing teams approach website optimization.
From a promotional standpoint, heatmaps help you understand the customer journey in unprecedented detail. You can see exactly which promotional elements capture attention, which ones are ignored, and where users get stuck in your conversion funnel. This insight allows you to craft promotional strategies that align with natural user behavior patterns rather than fighting against them.
How to Read and Interpret Heatmap Data Like a Pro 📈
Reading heatmaps effectively requires understanding both the technical aspects and the human psychology behind user behavior. Start by looking for patterns rather than individual data points. A single user clicking in an unusual spot might be an anomaly, but when hundreds of users exhibit the same behavior, that’s a trend worth investigating.
Pay special attention to unexpected hotspots – areas receiving high engagement that you didn’t anticipate. These often reveal user intent that you can leverage for better promotional placement. Conversely, cold spots in areas you expected to be popular indicate potential issues with visibility, messaging, or user experience design.
Context is everything when interpreting heatmap data. A heatmap showing low engagement with your promotional banner might seem negative, but if it’s placed below the fold and your scroll heatmap shows most users don’t reach that section, the issue isn’t the banner itself – it’s the placement strategy.
Always correlate heatmap insights with your conversion data. High engagement doesn’t automatically equal high conversion. Sometimes, areas with moderate engagement actually convert better because they attract more qualified prospects who are ready to take action.
Implementing Heatmap Insights for Better Promotional Strategies 💡
Once you’ve gathered heatmap data, the real magic happens during implementation. Start with quick wins – simple changes that can have immediate impact. If your heatmap shows users are clicking on non-clickable elements, make them clickable and link them to relevant promotional content or product pages.
Use scroll heatmap data to optimize your promotional content placement. If 70% of users scroll to a specific section, that’s prime real estate for your most important promotional messages. Don’t waste this valuable space on generic content when you could be driving conversions!
Heatmaps are particularly powerful for A/B testing promotional elements. Instead of guessing which version performs better, you can see exactly how user behavior changes between different promotional approaches. This visual feedback makes it much easier to understand why certain variations outperform others.
Consider mobile and desktop heatmaps separately, as user behavior patterns can vary significantly between devices. What works for desktop promotion might completely fail on mobile, and vice versa. This device-specific insight is crucial for creating comprehensive promotional strategies that work across all platforms.
Best Tools for Creating Effective Traffic Heatmaps 🛠️
Hotjar remains one of the most popular choices for businesses of all sizes, offering comprehensive heatmap functionality along with session recordings and user feedback tools. Their intuitive interface makes it easy for marketing teams to quickly extract actionable insights without requiring technical expertise.
Crazy Egg specializes specifically in heatmap technology and provides detailed click tracking, scroll maps, and overlay reports. Their confetti feature is particularly useful for segmenting clicks by traffic source, which helps optimize promotional campaigns for different audience segments.
FullStory offers enterprise-level heatmap capabilities combined with powerful search and segmentation features. While more expensive than other options, it provides incredibly detailed insights that can justify the investment for larger organizations with complex promotional strategies.
For smaller businesses or those just starting with heatmap analysis, Microsoft Clarity offers a completely free solution with surprisingly robust features. While it may lack some advanced functionality, it provides excellent value for understanding basic user behavior patterns.
Common Mistakes to Avoid When Using Heatmaps ⚠️
One of the biggest mistakes I see marketers make is jumping to conclusions based on insufficient data. Heatmaps need adequate sample sizes to provide reliable insights – typically at least 1,000 page views for meaningful patterns to emerge. Making promotional changes based on limited data can lead to poor decisions that actually hurt performance.
Another common pitfall is focusing exclusively on click density without considering the quality of those clicks. High engagement in areas that don’t contribute to your business goals might look impressive on a heatmap, but it’s essentially meaningless for promotional success. Always tie heatmap insights back to actual conversion metrics.
Don’t ignore mobile heatmap data! With mobile traffic often exceeding desktop traffic, promotional strategies that only consider desktop behavior are missing huge opportunities. Mobile users interact differently with content, and your promotional approach needs to account for these behavioral differences.
Finally, avoid the trap of over-optimization. While heatmaps provide valuable insights, constantly tweaking your promotional elements based on every minor pattern can create a chaotic user experience. Focus on significant trends and give changes time to prove their effectiveness before making additional modifications.
Real-World Success Stories 🌟
A leading e-commerce company used heatmap analysis to discover that customers were frequently clicking on product images expecting them to enlarge, but nothing happened. By making images clickable and linking them to detailed product pages with promotional offers, they increased conversion rates by 23% within just two weeks!
A SaaS startup found through scroll heatmaps that 85% of visitors never reached their pricing section, which was located at the bottom of their homepage. By moving key promotional pricing information above the fold and adding a prominent “View Pricing” button in the header, they doubled their trial signup rate.
An online education platform discovered that users were spending significant time reading testimonials but ignoring their main call-to-action button. By redesigning their promotional layout to place conversion buttons immediately after testimonial sections, they achieved a 40% increase in course enrollments.
Conclusion 🎉
Traffic heatmaps represent one of the most powerful yet underutilized tools in the digital marketer’s arsenal. They bridge the gap between assumption and reality, providing clear, visual insights into how users actually interact with your promotional content.
The key to heatmap success lies not just in collecting data, but in translating that data into actionable promotional strategies that align with natural user behavior patterns. When you understand where users look, click, and scroll, you can position your promotional elements for maximum impact and conversion potential.
Remember, effective promotion isn’t about forcing users to behave the way you want – it’s about understanding how they naturally behave and adapting your strategy accordingly. Heatmaps give you the insights needed to create promotional experiences that feel intuitive and compelling rather than pushy or confusing.
Start implementing heatmap analysis in your promotional strategy today, and prepare to discover insights that could transform your marketing effectiveness. The data is there waiting to be uncovered – you just need the right tools and approach to unlock its potential! 🔓
Frequently Asked Questions ❓
How long should I collect heatmap data before making promotional changes?
Generally, you should collect data for at least 2-4 weeks or until you have at least 1,000 page views to ensure statistical significance. However, if you’re seeing consistent patterns across multiple days with sufficient traffic, you can start making informed decisions sooner.
Do heatmaps slow down my website’s loading speed?
Modern heatmap tools are designed to have minimal impact on site speed. Most reputable providers use asynchronous loading and optimized code that adds less than 50ms to page load times – negligible for most users and search engines.
Can heatmaps track user behavior across different devices accurately?
Yes, quality heatmap tools provide device-specific tracking for desktop, tablet, and mobile. However, remember that user behavior patterns often differ significantly between devices, so analyze each device type separately for the most accurate promotional insights.
How do heatmaps handle user privacy and GDPR compliance?
Reputable heatmap providers anonymize all user data and don’t collect personally identifiable information. Most tools are GDPR compliant, but you should still include heatmap tracking in your privacy policy and cookie consent mechanisms.
What’s the difference between heatmaps and traditional analytics for promotional optimization?
Traditional analytics tell you what happened (bounce rate, conversion rate, etc.), while heatmaps show you why it happened by visualizing actual user behavior. This makes heatmaps particularly valuable for optimizing promotional element placement and design.


